The Item Quantity Overlap report shows the maximum quantity of selected items rented at any one time over the entire time period this item has been inventoried. This report is very helpful to determine if you have too much depth of inventory for a particular item. You can get this same report under File Maintenance, Item Inquire, Qty Overlap; however, that report only allows for a single item. This report allows you to select multiple items.
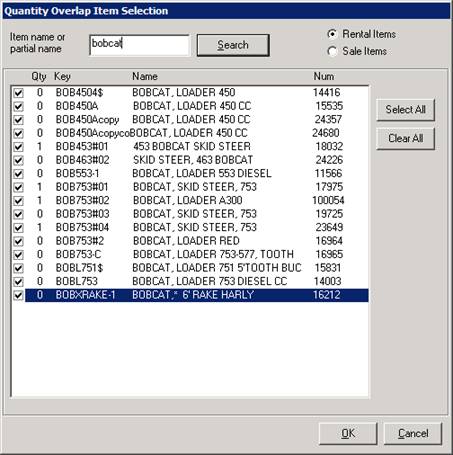
When you select this option, you will get a screen similar to the following screen. Enter a partial name of the item you are interested, such as “BOBCAT”. Next all of the matching items will be displayed. Click on the box for the items you want included in the report. Note: Header items will not be displayed.
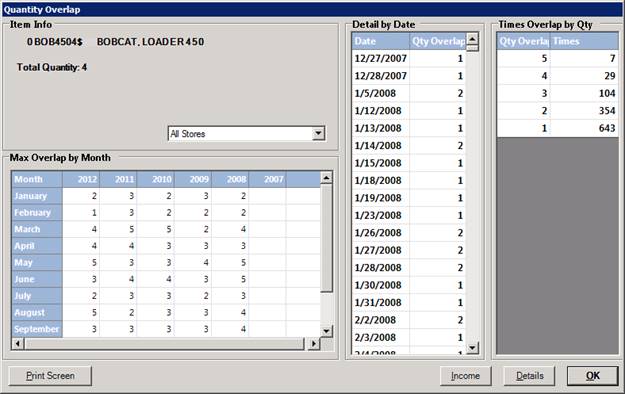
Next a summary screen will be displayed as follows:
Max Overlap per Month maximum number of items out on a particular day for each month.
Detail by Date shows the total number of items out on each particular date.
Times Overlap by Qty shows the count of number of days that the items had that quantity out.
Print – This button will print the maximum overlap by month.
Income – This button will print a month-by-month summary income for all of the items you selected. The screen will look similar to the following:
•Note – Items marked in red shows a decrease in income from same month previous period. (ex) Jan 2015 was a decrease income from Jan 2014.

View Options – You can select different ways of viewing the income by year by checking one of the follwing boxes ( Avg Income per Unit, Times Out, Monthly Chart, Yearly Chart, Year to Date).
Detail – This button will print a detailed report showing the monthly breakdown of revenue, maximum quantity out, average quantity out, and minimum quantity out for each year and each month for the last 7 years. The report will look similar to the following:
